
Instagram Engagement Rate Calculator
Enter averages from your last 5-10 posts for the most accurate result.
Enter averages from your last 5-10 posts. Add reach or impressions from Instagram Insights for a more precise result.
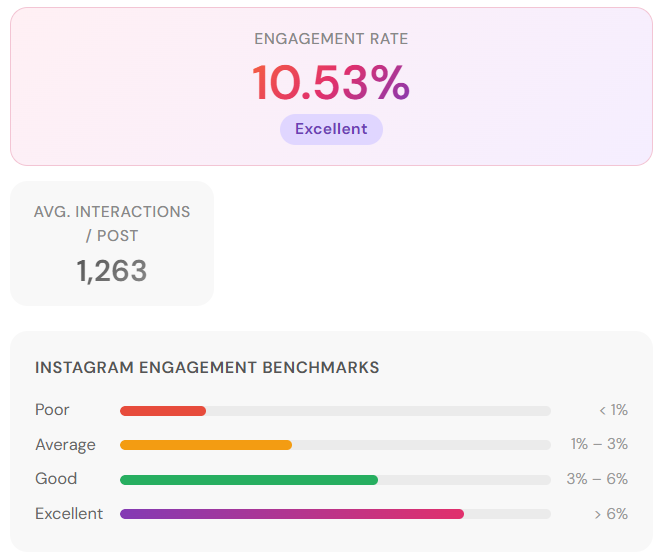
Instagram Engagement Rate Benchmarks Chart
See how your result compares across follower tiers, rating categories, and content formats.
Instagram Engagement Rate Calculator
Follower count tells you how big an audience is. Engagement rate tells you whether anyone is actually paying attention.
Enter the average likes, comments, and follower count from any Instagram account’s recent posts.
This free Instagram engagement rate calculator calculates your Instagram engagement rate and benchmark in seconds.
What Is Instagram Engagement Rate?
Instagram engagement rate is the percentage of an account’s followers who interact with its content through likes, comments, shares, or saves.
It’s the metric brands, agencies, and marketers rely on to assess audience quality because follower counts can be bought, but consistent engagement is much harder to fake.
Instagram Engagement Rate Formula
If an account has 20,000 followers and averages 400 likes and 40 comments per post, their engagement rate is (440 ÷ 20,000) × 100 = 2.2%.
Our Instagram engagement rate calculator above runs this automatically. Enter the averages from a handful of recent posts and you have your result.
How to Use This Instagram Engagement Rate Calculator?
You don’t need to count every post you’ve ever published. Here’s the method that takes under 60 seconds to calculate Instagram engagement rate.
Step 1: Open the Instagram profile you want to analyze. Look at the 5–10 most recent posts and note the likes and comments on each.
Step 2: Average the likes and comments separately across those posts.
Step 3: Enter those averages and the account’s current follower count into the calculator.
Step 4: Hit calculate. You’ll get an engagement rate percentage and a benchmark rating — Poor, Average, Good, or Excellent.
Basic Mode vs. Advanced Mode
Basic Mode uses likes and comments. The only data publicly visible on any Instagram profile.
Use Instagram engagement rate calculator basic mode when evaluating any account you don’t own.
Advanced Mode adds saves and shares, and lets you use reach or impressions as the denominator instead of followers.
Use this when analyzing your own account through Instagram Insights.
Reach-based engagement rate is more precise because it measures only people who actually saw the post, not your entire follower count, which includes inactive and ghost accounts.
What’s a Good Instagram Engagement Rate?
Benchmarks shift significantly by account size. A 1% rate is a warning sign for a 5,000-follower account but completely normal for a 2-million-follower celebrity.
Always compare within the same follower tier. Cross-tier comparisons are meaningless.
| Account Tier | Followers | Good Rate | Average Rate |
|---|---|---|---|
| Nano | 1K – 10K | 4% – 8% | 2% – 4% |
| Micro | 10K – 50K | 2% – 4% | 1% – 2% |
| Mid-tier | 50K – 500K | 1.5% – 3% | 1% – 1.5% |
| Macro | 500K – 1M | 1% – 2% | 0.5% – 1% |
| Celebrity | 1M+ | 0.5% – 1% | 0.3% – 0.5% |
The overall Instagram platform average is 0.30–0.48% across all account sizes in 2026.
This is down roughly 17% year-over-year as feeds become more algorithmic and content competition increases.
Use our Instagram engagement rate calculator above to find out in which account tier you are in.
Instagram Engagement Rate by Industry
Account size isn’t the only benchmark that matters. Industry plays a significant role.
A fashion brand and a software company with identical follower counts will naturally produce very different engagement rates because of how differently their audiences use Instagram.
| Industry | Average Engagement Rate |
|---|---|
| Food & Beverage | 1.8% – 2.5% |
| Fashion & Apparel | 0.8% – 1.4% |
| Health & Fitness | 1.6% – 2.8% |
| Beauty & Skincare | 1.2% – 2.0% |
| Travel | 1.0% – 1.8% |
| Education | 2.0% – 3.5% |
| B2B / SaaS | 0.5% – 1.0% |
| Non-profit | 2.5% – 4.0% |
| Entertainment | 1.5% – 2.5% |
A B2B software brand at 0.8% isn’t underperforming. That’s strong for their category. A fashion account at 0.8% with 20,000 followers has a real problem.
Use these industry benchmarks alongside the follower-tier table above for the most accurate read on where an account actually stands.
Why Engagement Rate Matters More Than Follower Count?
An account with 15,000 followers and a 5% engagement rate generates 750 interactions per post.
An account with 200,000 followers and a 0.5% rate generates 1,000. Barely more, from an audience thirteen times larger, at significantly higher cost per post.
For brands evaluating influencer partnerships, a low engagement rate relative to follower count is the clearest signal of bought followers or an audience that has disengaged over time.
Purchased followers don’t click links, don’t leave genuine comments, and don’t convert into customers.
Running any account through an Instagram engagement rate calculator before committing budget is standard practice in influencer marketing for exactly this reason.
Smaller accounts in focused niches such as fitness, personal finance, home renovation regularly outperform larger generalist accounts for campaign ROI.
Because their audiences are genuinely interested in the topic, not just passively following.
How to Improve a Low Instagram Engagement Rate?
If your Instagram engagement rate came back lower than expected, these are the five factors most likely responsible and what you can actually do about each.
Clear out ghost followers
Every account accumulates inactive followers over time.
People who stopped using Instagram but remain in your count.
These accounts drag your engagement rate down silently because they never interact.
Third-party tools can identify and remove them in bulk.
It won’t feel good to watch your follower number drop, but your Instagram engagement rate will reflect your real audience far more accurately afterward.
Switch more posts to carousels
Studies show carousels can generate upto 3x more engagement than static images.
Each swipe registers as a separate interaction with Instagram’s algorithm, and carousels keep users on your post longer.
Both signals the algorithm uses to decide how widely to distribute your content.
If your feed is predominantly static images, shifting even 30–40% of output to carousels is one of the most reliable structural improvements you can make.
Post less, not more
Accounts posting 3–5 times per week consistently outperform those posting daily in per-post engagement.
Instagram’s algorithm heavily weights early engagement signals in the first 60 minutes after a post goes live.
Spreading posts out gives each one more room to accumulate those early interactions before the next post competes for the same audience’s attention.
Post when your audience is actually online
The first hour after publishing is very important.
High early engagement signals Instagram to distribute your post more broadly, which generates more engagement, which compounds further.
Check your Instagram Insights for peak audience activity times and schedule posts around those windows rather than posting at whatever time is convenient.
Create content people want to save
Instagram weighs saves and shares more heavily than likes in its ranking algorithm because they signal genuine value.
Someone found your content worth returning to or passing on.
Tutorials, reference posts, data breakdowns, and useful lists consistently generate saves.
Shifting some of your content toward formats people bookmark rather than just double-tap will improve both your engagement rate and your algorithmic reach over time.
Frequently Asked Questions
Can I check someone else’s Instagram engagement rate with this calculator?
Yes. For any public account, note the average likes and comments from their last 5–10 posts, enter those alongside their follower count, and calculate.
This is the same method brands and agencies use when evaluating influencer accounts before a paid campaign.
What does it mean if my engagement rate is below 1%?
For large accounts over 500,000 followers, below 1% is normal and not a concern. For accounts under 50,000, it’s worth investigating.
Common causes are ghost followers, a content format that stopped resonating, or reduced algorithmic reach from a posting pattern change.
One slow month doesn’t define an account. Look at the trend across 3–4 months.
How often should I check my Instagram engagement rate?
Monthly is the right window for most accounts. Checking per post is too frustrating.
A single outlier skews your read on what’s actually happening. A monthly average across your last 10–15 posts gives a reliable trend line.
Is engagement rate calculated differently for Reels?
The formula is the same, but because Reels reach non-followers through Explore, many marketers calculate Reel-specific engagement using reach as the denominator rather than followers.
This gives a more accurate picture of how the content performed relative to who actually saw it.
Our Instagram engagement rate calculator uses the follower-based formula by default which is the standard for comparing accounts against each other.
Does a higher engagement rate always mean better performance?
Generally yes, but always compare within the same niche and follower tier.
A 2% rate for a 300,000-follower lifestyle account and a 2% rate for a 300,000-follower B2B software account represent very different audience dynamics.
Use the industry table above alongside the tier benchmarks for the most accurate assessment.
How do brands calculate influencer engagement rate before a campaign?
Most brands and agencies use the same formula which our Instagram engagement rate calculator uses.
Average likes plus comments from recent posts, divided by follower count, multiplied by 100.
Some add saves if the influencer shares their Insights data.
The result gets compared against tier benchmarks to determine whether the audience is genuinely engaged or artificially inflated before any budget is committed.